Wages. Prices. Purchasing power.
Wage vs Prices
Has pay in your occupation kept up with rising prices? Compare wages and price changes over time.
Occupation wages are county-level. Harju County includes Tallinn; Tartu County includes Tartu city municipality and other municipalities. Compare overall city or municipality wages
Separate comparison · all occupations combined
City or municipality pay is not county pay
Harju County includes Tallinn. Tartu County, Tartu city municipality and Tartu rural municipality are three different areas. Compare published municipality wages with county and national figures here.
Wage history for this area
Boundaries, missing data and source
The selector uses the source’s current municipality labels. Earlier-boundary records labelled “until” are not joined to newer records. Missing values stay unpublished, not zero or a neighbouring area’s pay. Employee counts are the source’s employment measure, not municipality population.
This view does not present county apartment prices as city apartment prices. Overall wages do not describe a specific occupation or track the same person’s pay growth. Figures are gross pay, not take-home pay.
Your pay · calculated in this browser
Compare your gross salary
Choose your occupation and workplace county above. For a city or municipality comparison, choose the area in the municipality section. These benchmarks stay separate; they are not combined into an invented city-by-occupation salary.
Choose occupation and county · Choose city or municipality
Enter your gross salary to see the comparison.
Has your own pay kept up with inflation?
Optionally enter your earlier gross monthly salary on the same full-time-equivalent basis. This compares your two salaries, not your occupation group’s wage growth.
Calculation and limitations
Difference in euros = your salary − published median. Percentage difference = (your salary / median − 1) × 100. Real pay change = ((new salary / earlier salary) / (end-quarter CPI / start-quarter CPI) − 1) × 100. Missing medians are not estimated. A median cannot establish your exact percentile. The calculation does not include taxes or your personal spending basket.
Longer view · Estonia as a whole
Wages and prices since 2002
This view shows Estonia’s mean gross monthly wage, not the occupation or county selected above. Compare it with consumer prices and apartment or house price indices.
Historical values and sources
Wage series · Consumer price index IA002 · Dwelling price index IA028
How are the results calculated?
The comparison shows changes in published gross wages and prices. It does not estimate your personal salary or calculate after-tax purchasing power.
Chart and calculation formulas
In the formulas below, “start” and “end” mean the selected starting and ending quarters. Each chart line starts at 100, so changes can be compared despite different units: euros, price indices or euros per square metre.
- Chart index: 100 × quarter value / starting-quarter value.
- Wage or price change (%): 100 × (end value / start value − 1).
- Inflation-adjusted wage change (%): 100 × ((end wage / start wage) / (end CPI / start CPI) − 1).
- End wage at starting-quarter prices: end wage / (end CPI / start CPI).
- One gross monthly wage, m²: gross monthly wage / median apartment transaction price (€/m²) in the same quarter. This is a price-to-wage ratio, not savings or borrowing capacity.
Illustrative example with fictional figures: if wages rise 20% and prices rise 10%, inflation-adjusted wage growth is 9.1%, not 10%. Calculation: (1.20 / 1.10 − 1) × 100. Results are rounded for display, not before calculation.
What do the source measures mean?
Occupation-group wages are published full-time-equivalent gross monthly wages from Statistics Estonia’s wage application. The median divides wages into two equal halves; the mean is the arithmetic average. This tool uses published measures rather than calculating medians from individual salaries. County means the registered workplace location, not the employee’s residence. Job-title search helps identify a group; it does not provide a separate salary measure for every title.
Quarterly CPI is the arithmetic mean of three monthly index levels, not the average of monthly inflation rates. CPI describes national consumer prices, not county living costs or your personal basket. IA002 succeeds IA02 with the same base (1997 = 100). The longer-history view uses IA002.
County apartment prices are the published median transaction price per square metre in the Land and Spatial Development Board’s T13 report. The county total row is used, not an average of size-group medians; trimming is 0%. Transaction counts appear alongside prices. The mix of sold apartments can change, so this is not the change in value of the same apartment.
Missing data and longer-history limitations
Unpublished values are not replaced with zero, estimates or national averages. Chart lines break at missing observations. Changes require both starting and ending values. Where a wage-history chart is absent, some observations come from directly published values on the same source’s county map. These are not estimates.
The longer-history wage line shows Estonia’s mean gross monthly wage, not the selected occupation’s pay. PA001 and PA113 use different methodologies and differ during their overlap. They are shown separately, with no wage-change calculation across the methodology break. IA028 apartment and house price indices describe national price changes; they are not county median prices in euros per square metre.
Source data may be revised. A retrieval date does not imply automatic live updates. OEJ’s calculations are an independent comparison, not an official result issued by the source agencies.
Wage methodology CPI: IA002 PA001 PA113 IA028 Apartment transaction data
Background research Business and trade data The earlier sector-in-numbers data tool and the national trade estimate, kept as background research.
Estonian business · Statistics Estonia data
Your sector in numbers
Choose a sector. Explore where businesses operate and how their numbers have changed. Below the map, find a separate estimate for trade across Estonia.
Jump to the national trade estimate ↓
All Estonia · Trade and vehicle repair
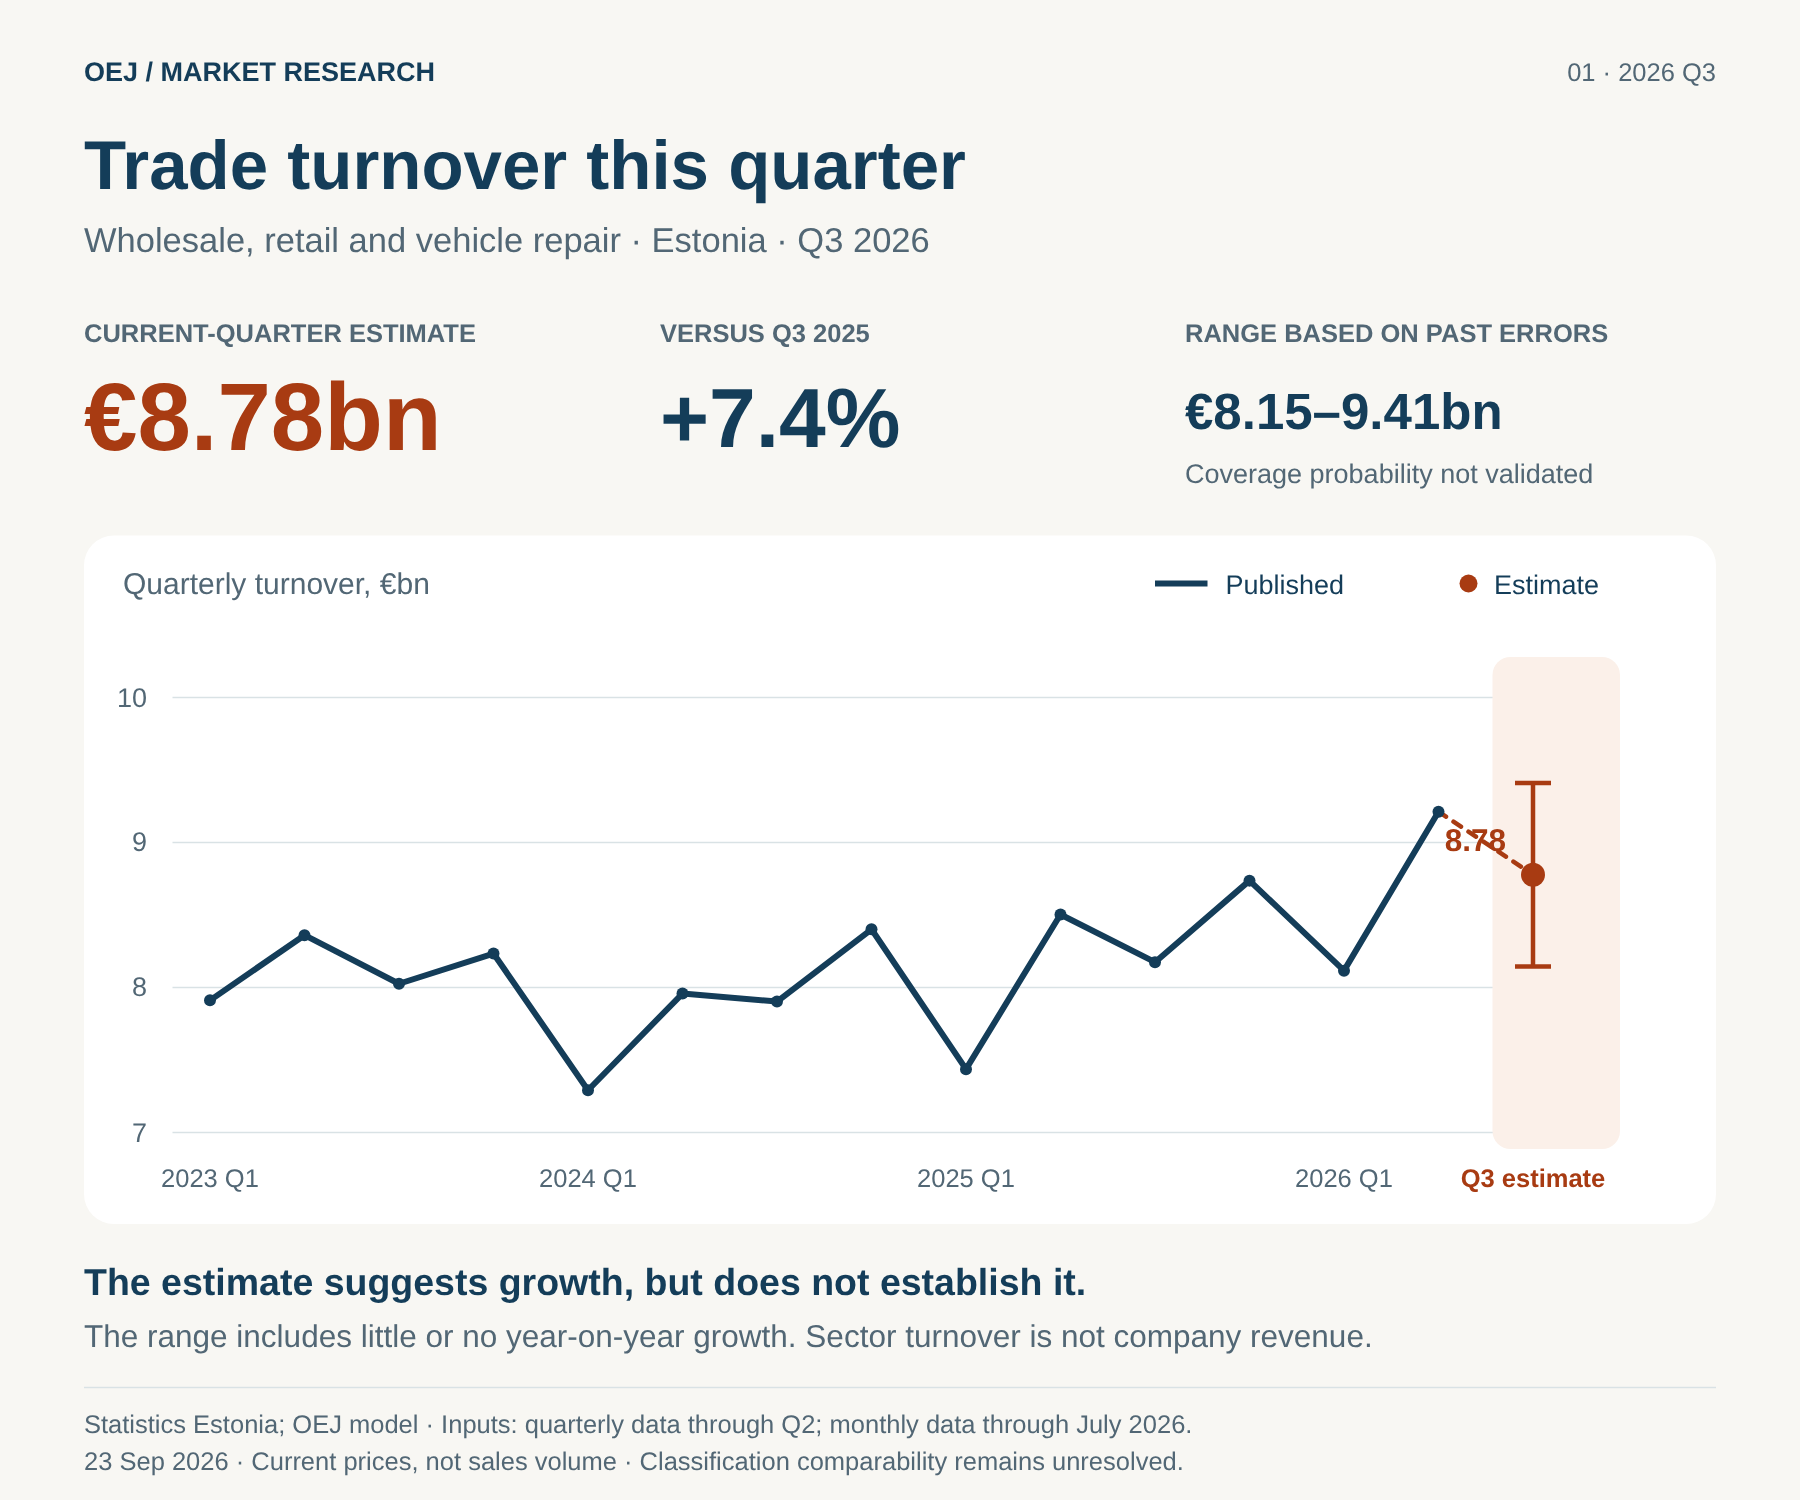
Q3 2026 turnover estimate
This estimate does not change with your county or sector selection. It covers national wholesale and retail trade and repair of motor vehicles and motorcycles under EMTAK 2008.
The effect of the activity-classification transition on comparability remains unresolved. The estimate uses revised data. Do not treat it as a forecast of your own revenue or market demand.
Issued 23 September 2026. Quarterly inputs extend through Q2 2026 and monthly inputs through July 2026. This is a fixed data snapshot, not an automatically updated forecast.
| Point estimate | €8.78bn |
|---|---|
| Change from the same quarter last year | +7.4% |
| Range based on past errors | €8.15bn to €9.41bn |
The range is not a validated 80% prediction interval. Actual turnover may fall outside it. It includes approximately unchanged year-on-year turnover, so the point estimate does not establish growth.
How did it perform on historical quarters?
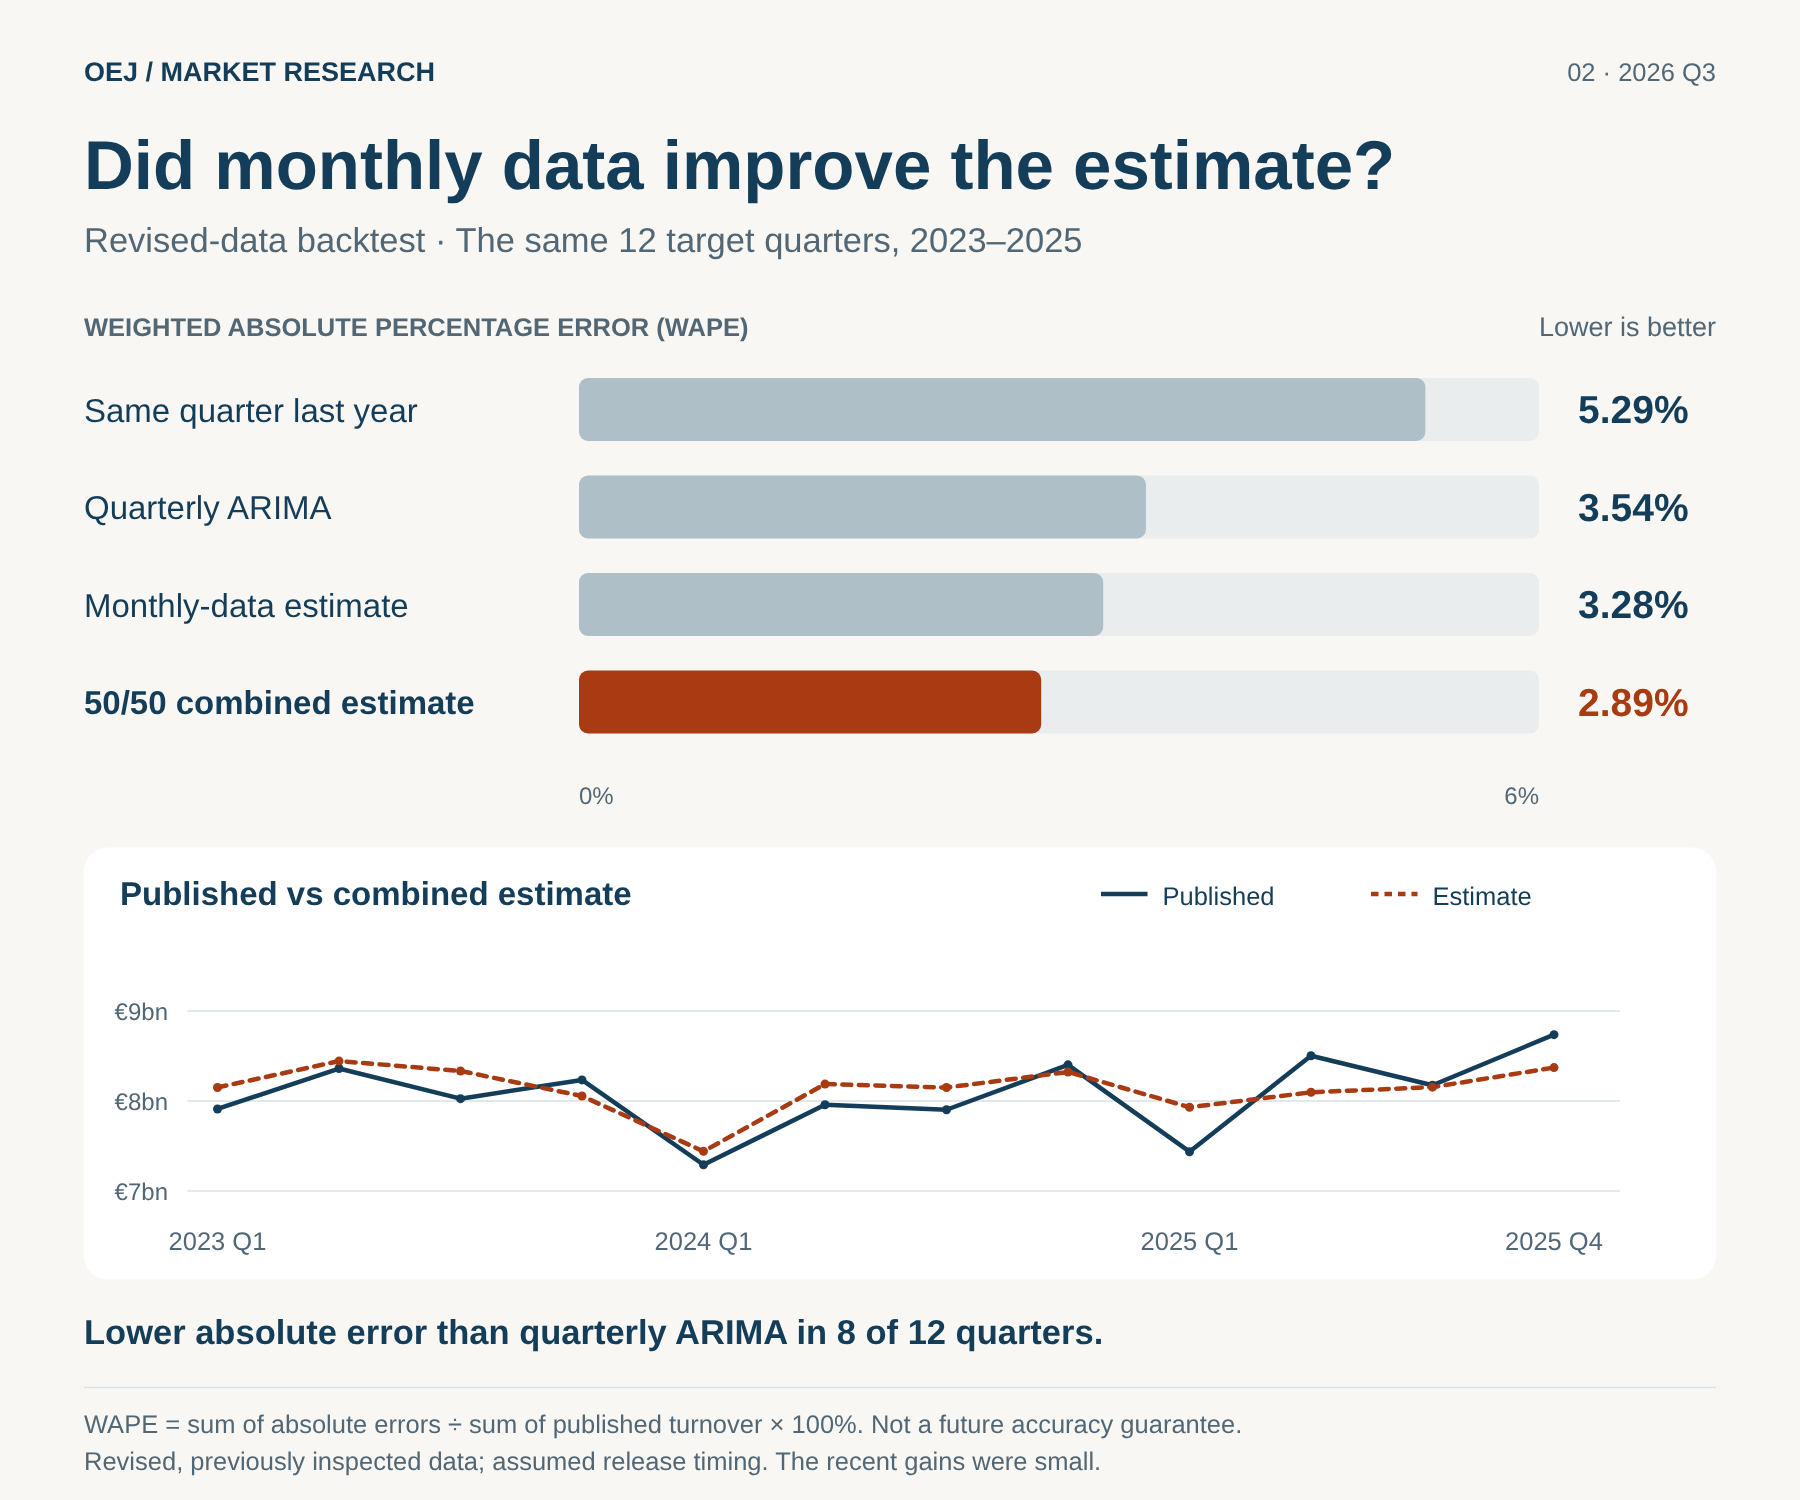
The comparison covers the same 12 quarters in 2023 to 2025. Lower WAPE means lower error in this test, not assured future accuracy.
| Method | WAPE |
|---|---|
| Same quarter last year | 5.29% |
| Quarterly ARIMA | 3.54% |
| Monthly-data estimate | 3.28% |
| 50/50 combined estimate | 2.89% |
Method, error metric and limitations
The combined estimate is the arithmetic mean of a seasonal ARIMA estimate from quarterly data and a monthly-data estimate. Each has a 50% weight, fixed before this test.
The monthly estimate uses first-month year-on-year nominal turnover ratios, weighted by division shares in the same quarter of the previous year. Wholesale uses a value index, not a volume index.
WAPE = sum of absolute errors / sum of published turnover × 100%. This is not the simple mean of quarterly percentage errors or “97.11% accuracy”.
The test uses revised data and already-examined periods. Actual historical release dates and first-release vintages have not been reconstructed. The result supports further testing, not a reliability promise.
The ranges use previous absolute errors from the same method. The current range is based on 22 quarterly errors.